Order Flow · Pine Script · TradingView

Read the
market's
intentions.

DepthFlo translates raw footprint and volume data into a visual language for short-term price action — accumulation, absorption, imbalance, and price magnets.

Platform TradingView
Best on NQ · ES · CL · GC
Timeframe 15s — 5m
DepthFlo logo
DepthFlo on NQ 15-second chart showing liquidity zones and imbalance bubbles
NQ1! · 15s · LIVE CME · NASDAQ 100 E-MINI
How to read it

Every bubble, zone, and line is saying something.

DepthFlo distills four order-flow primitives into a clean visual layer — built to read the same way professional flow traders think about price.

Liquidity zones
01 / Liquidity Zones

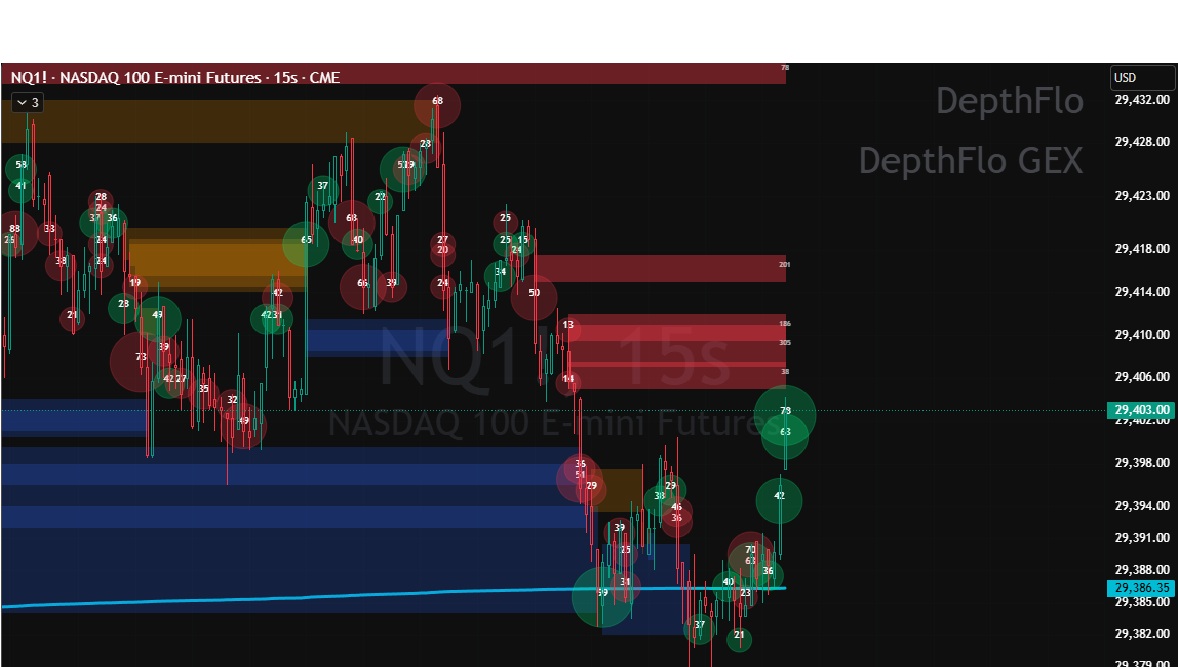
Where volume already showed its hand.

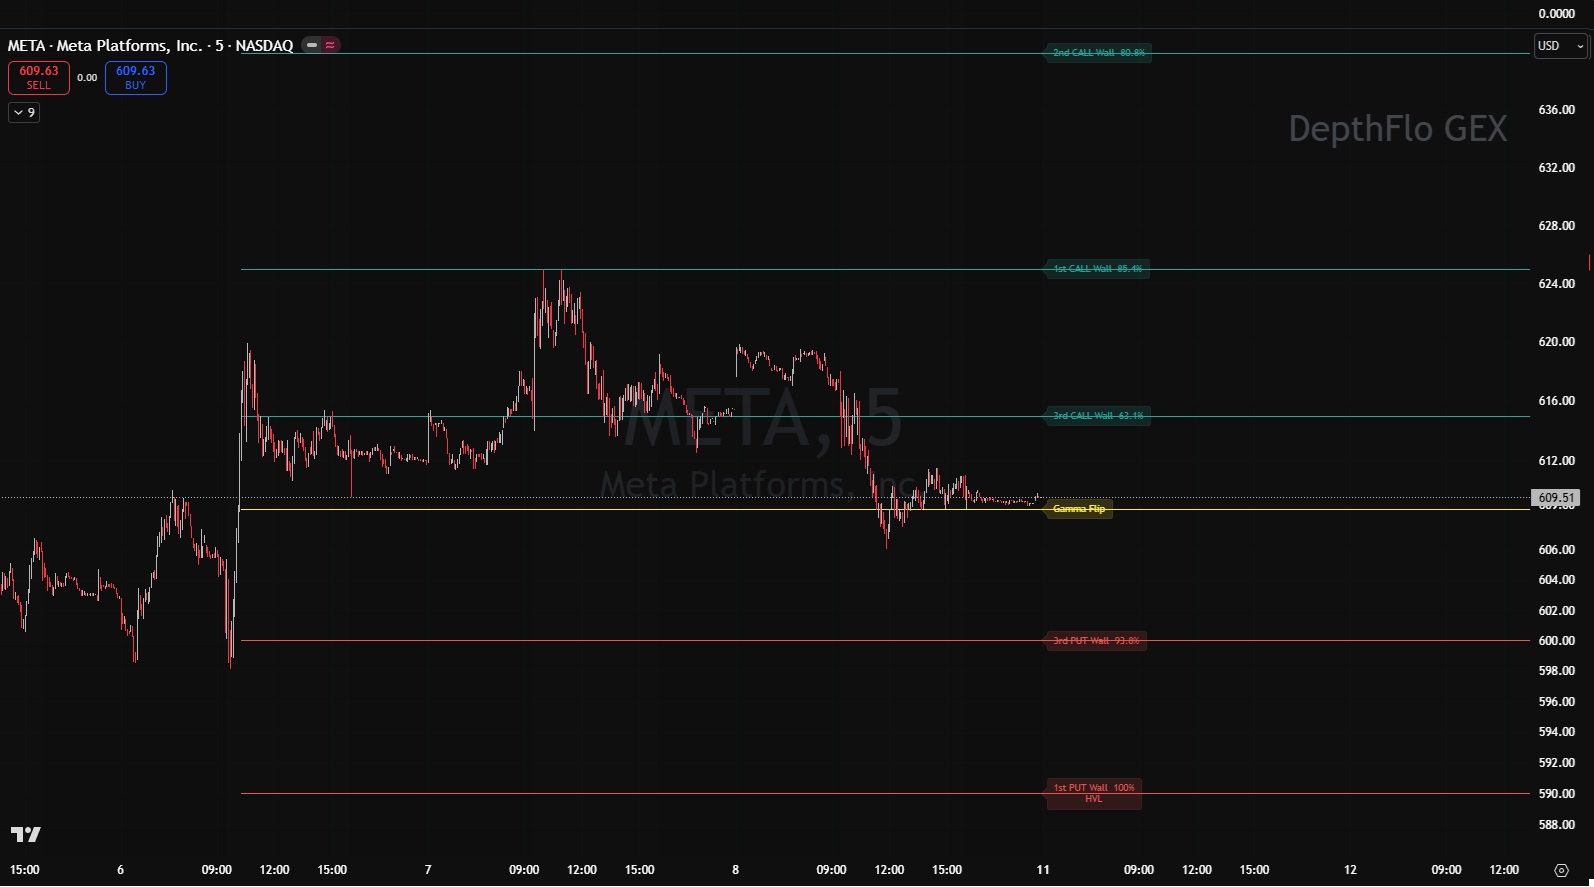
Persistent horizontal bands mark price levels where significant volume accumulated. Color tells you whether the zone is still defending price or has already been broken — green and red are live battle lines; orange and blue are history, frequently the spot for role reversal.

Support Resistance Capped (was R) Capped (was S)
Imbalance bubbles showing absorption and contrarian flow
02 / Imbalance Bubbles

Footprint events at a glance.

Each bubble is a snapshot of aggressive volume hitting one side of the market. Color shows direction; position on the bar shows the story — absorption on wicks, exhaustion at extremes, contrarian flow late in a move.

Buy imbalance Sell imbalance
POC magnets and zone expansion
03 / POC Magnets & Expansion

The bars that mattered.

Yellow magnets flag bars where one price absorbed unusually heavy volume relative to the symbol's recent norm — often exhaustion turns or pre-breakout coils. Watch for fresh zones forming as price commits to new territory.

POC magnet New zone
Value area, POC and dual VWAPs
04 / Value Areas & Dual VWAPs

The anchors price keeps returning to.

Session POC, value area high and low frozen at the open. Previous-day reference levels projected forward. Two anchored VWAPs — RTH and ETH — with the spread between them tinted to show session bias at a glance.

POC VAH / VAL · RTH VWAP ETH VWAP
DepthFlo GEX · Companion Indicator · Invite-Only

Where price wants to pin.

Order flow shows you what's happening on the tape. DepthFlo GEX shows you where the options market is positioned — the call walls that cap rallies, the put walls that catch dips, and the gamma flip that decides whether today is mean-reverting or trending. Live levels, refreshed every morning. No spreadsheets, no API keys, no setup.

DepthFlo GEX on META 5-minute chart showing call walls, put walls, gamma flip, and HVL
META · 5m · CALL/PUT WALLS · GAMMA FLIP · HVL
CALL WALLS · 1ST / 2ND / 3RD

Where rallies stall.

Green levels marking where positive dealer gamma concentrates. Each tagged with its strength as a percentage of the day's largest position. Acts as resistance and upside pin magnets — the higher the strength, the harder the level usually defends.

PUT WALLS · 1ST / 2ND / 3RD

Where dips catch.

Red levels marking where negative dealer gamma concentrates. Same 1/2/3 stack with strength percentages. The dealers' protective hedging buys here often defend the level on first test, especially when above the gamma flip.

GAMMA FLIP

The line that changes the day.

Yellow line dividing two volatility regimes. Above: dealers are long gamma — expect range-bound, mean-reverting tape. Below: dealers are short gamma — expect trending, faster, more volatile moves. Knowing which side you're on changes how you trade everything else.

HVL · HIGH VOLUME LEVEL

The day's pin target.

Blue line marking the single strongest gamma strike of the day — the market's gravitational center. Often the answer to "where does this close?" When other walls give way, price tends to find its way back here.

One thing to remember — restart TradingView between 9:15 and 9:30 AM ET so your chart loads the day's fresh levels before the cash open. Leave it running overnight and you'll see yesterday's map.
Supported markets

Switch tickers, the levels follow.

Continuous contracts, quarterly contracts, and broker-prefixed tickers all resolve to the right levels automatically by symbol root. Zero configuration.

Indices & ETFs
SPY QQQ DIA
Single Names
NVDA TSLA AAPL MSFT AMZN META
Futures
ES NQ YM
Micro Futures
MES MNQ MYM
Two indicators · One ecosystem · Available on Whop

Stop guessing.
Start reading the tape.

Order flow tells you what just happened. GEX tells you where it wants to go. Add DepthFlo to your TradingView chart and see both at once.

Get DepthFlo on Whop