Order Flow · Pine Script · TradingView

Read the
market's
intentions.

DepthFlo translates raw footprint and volume data into a visual language for short-term price action — accumulation, absorption, imbalance, and price magnets.

Platform TradingView
Best on NQ · ES · CL · GC
Timeframe 15s — 5m
DepthFlo logo
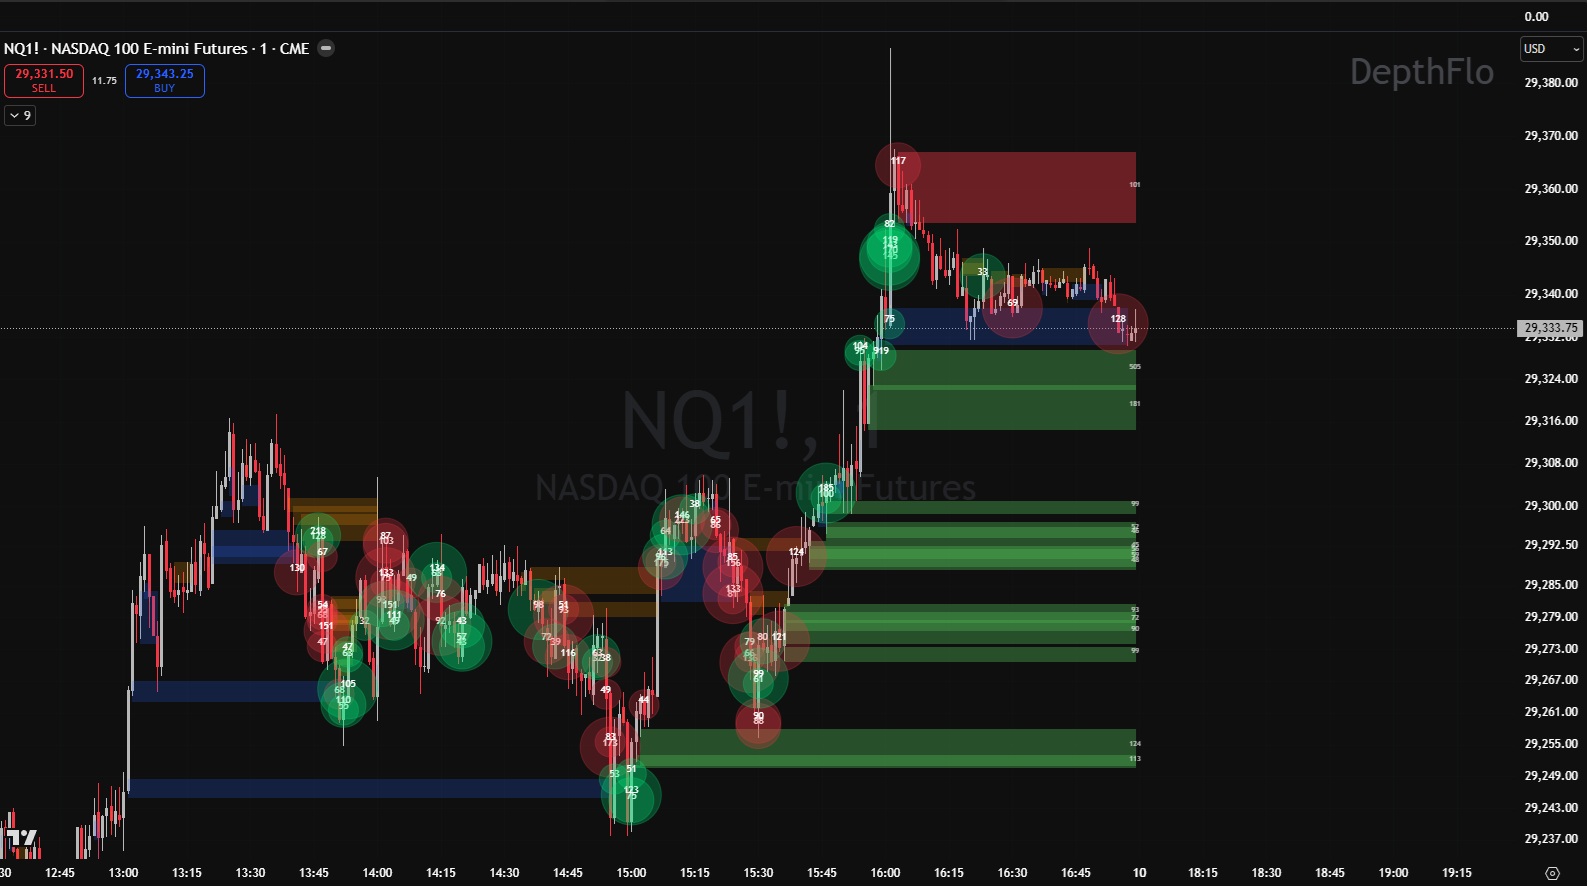
DepthFlo on an NQ chart showing liquidity zones and imbalance bubbles
NQ1! · 15s · LIVE CME · NASDAQ 100 E-MINI
How to read it

Every bubble, zone, and line is saying something.

DepthFlo distills four order-flow primitives into a clean visual layer — built to read the same way professional flow traders think about price.

Liquidity zones
01 / Liquidity Zones

Where volume already showed its hand.

Persistent horizontal bands mark price levels where significant volume accumulated. Color tells you whether the zone is still defending price or has already been broken — green and red are live battle lines; orange and blue are history, frequently the spot for role reversal.

Support Resistance Capped (was R) Capped (was S)
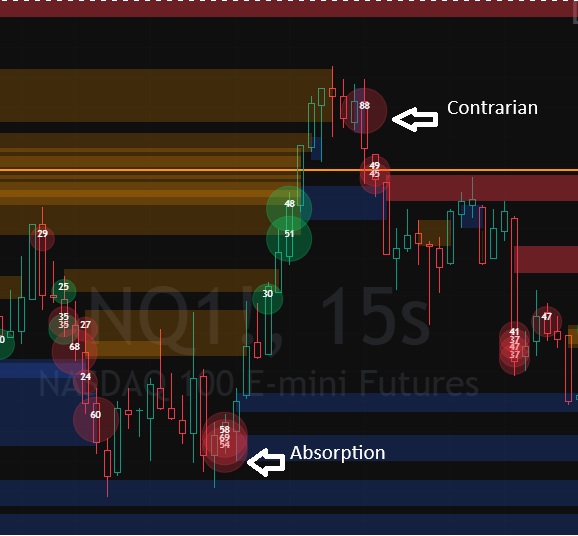
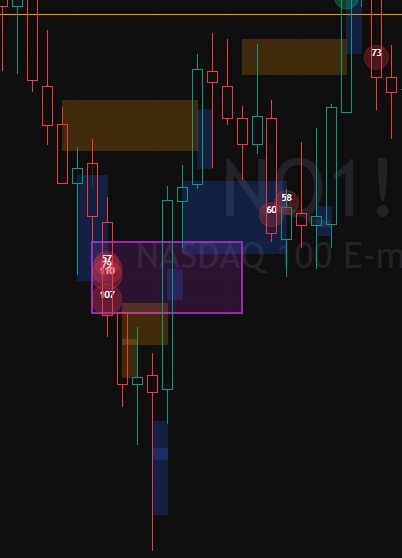
Imbalance bubbles showing absorption and contrarian flow
02 / Imbalance Bubbles

Footprint events at a glance.

Each bubble is a snapshot of aggressive volume hitting one side of the market. Color shows direction; position on the bar shows the story — absorption on wicks, exhaustion at extremes, contrarian flow late in a move.

Buy imbalance Sell imbalance
POC magnets and zone expansion
03 / POC Magnets & Expansion

The bars that mattered.

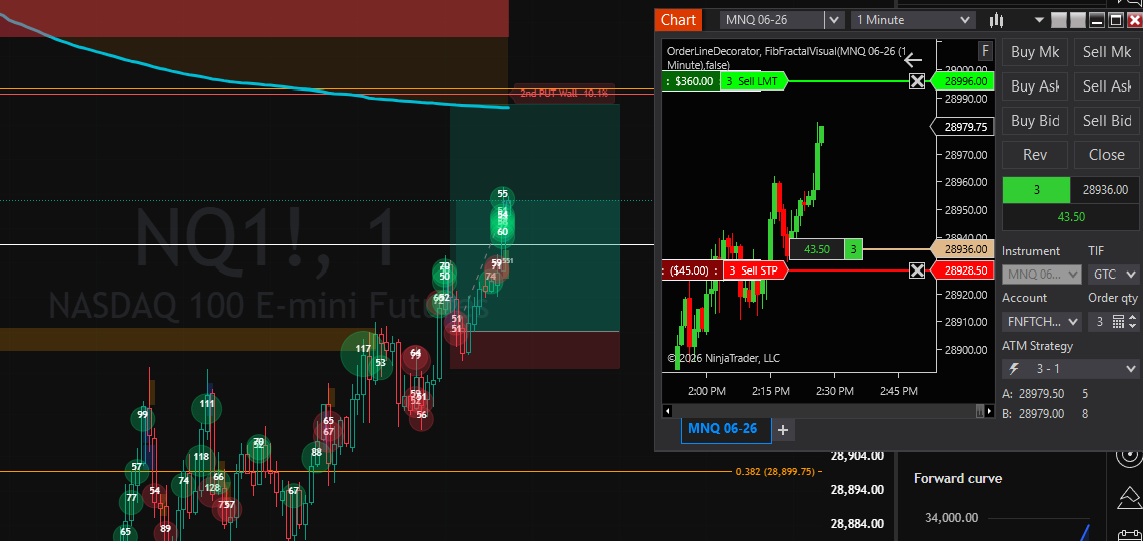
Yellow magnets flag bars where one price absorbed unusually heavy volume relative to the symbol's recent norm — often exhaustion turns or pre-breakout coils. Watch for fresh zones forming as price commits to new territory.

POC magnet New zone
Value area, POC and dual VWAPs
04 / Value Areas & Dual VWAPs

The anchors price keeps returning to.

Session POC, value area high and low frozen at the open. Previous-day reference levels projected forward. Two anchored VWAPs — RTH and ETH — with the spread between them tinted to show session bias at a glance.

POC VAH / VAL · RTH VWAP ETH VWAP
DepthFlo Daily Ranges · Statistical Price Map

Know the range before price tests it.

DepthFlo Daily Ranges turns historical price behavior into a clear intraday map. The shaded expected zone shows where price is statistically most likely to remain, while the outer extensions highlight high-probability levels when the market pushes beyond its normal range.

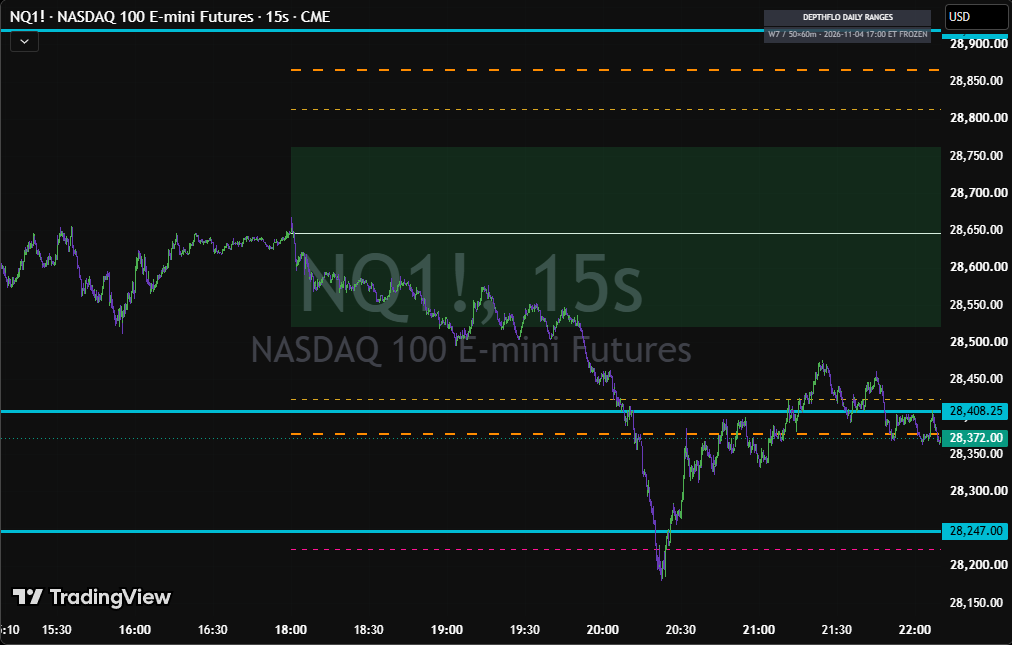
DepthFlo Daily Ranges on an NQ 15-second chart showing the green statistical range and extension levels
NQ1! · 15s · STATISTICAL RANGE · EXTENSIONS
EXPECTED RANGE

Where price is most likely to stay.

The green shaded zone marks the session's statistically expected range. While price remains inside it, the market is moving within its normal daily behavior and the boundaries provide clear context for rotations and tests.

RANGE BOUNDARIES

A decision point for the breakout.

The upper and lower boundaries define where normal range behavior ends. Acceptance outside the shaded zone can signal expansion, while rejection back inside can show that the attempted breakout failed.

STATISTICAL EXTENSIONS

High-probability levels beyond the range.

The extension lines project statistically significant levels above and below the expected zone. When price breaks out, these levels provide objective areas to watch for continuation targets, reactions, or exhaustion.

Read the map, then read the reaction — the ranges provide statistical context, not a directional signal. Watch how price behaves at the shaded-zone boundaries and extensions to distinguish acceptance, rejection, and breakout continuation.
Order flow · Daily ranges · One ecosystem · Available on Whop

Stop guessing.
Start reading the tape.

Order flow shows what is happening now. Daily Ranges show where price is statistically most likely to stay—and the high-probability levels to watch when it breaks out.

Get DepthFlo on Whop →